
 Facebook
 Twitter
 Pinterest
 Copy Link
How to Avoid Overpaying for a Home in a Transitioning Market

Look Carefully at the Home Itself
Here are four home attributes beyond the number of bedrooms and baths that you should have your eye on…
Home (building) quality: Very well-built homes are a rare find and typically worth every penny of their price. Don’t confuse them with so-so homes that just measure up to the city inspector’s threshold. Lesser quality homes will cost you more in upkeep and replacement as systems and components wear out. If you purchase a lesser quality home for less, the differential might just cover the added maintenance expense. But, if you purchase a fair quality home at the going rate of higher quality homes, you might likely be overpaying.
Deferred maintenance: Different than home quality, deferred maintenance includes the to-do list of items that need to be done to maintain a home’s integrity. A home that has been well maintained over its life typically is a better investment than one that hasn’t. The true cost of deferred maintenance often adds up to more than the cost of the repairs themselves. Don’t forget to factor in the reduced life span of other components—like replacement of damaged wood beneath peeling paint or mold remediation in a damp basement caused by a clogged foundation drain.
Setting: The saying “location, location, location” didn’t get its fame from out of nowhere. A home with an ideal setting on its lot and in the neighborhood—away from busy roads and utility poles/boxes, with adequate privacy, good topography, best positioned to capture views if available, and not adjacent to undesirable elements (poorly maintained homes, water towers or other unsightly public structures, high traffic facilities, etc.) will have more value than a less-ideally sited home. When deciding what to pay for a property it is critical that you evaluate these aspects and any others relevant to a specific neighborhood to determine the +/- effect on value.
Floor plan: How a home lives—flow from room to room, size of rooms, open/closed-off spaces, and below ground vs. above ground living are every bit as important as the total home square footage. You can change a lot of things about a home, but it is very difficult to change a bad floor plan. When you are deciding how high to make that multiple offer bid, consider factoring in the added value or take-away of the floor plan.
Beyond the Four Walls
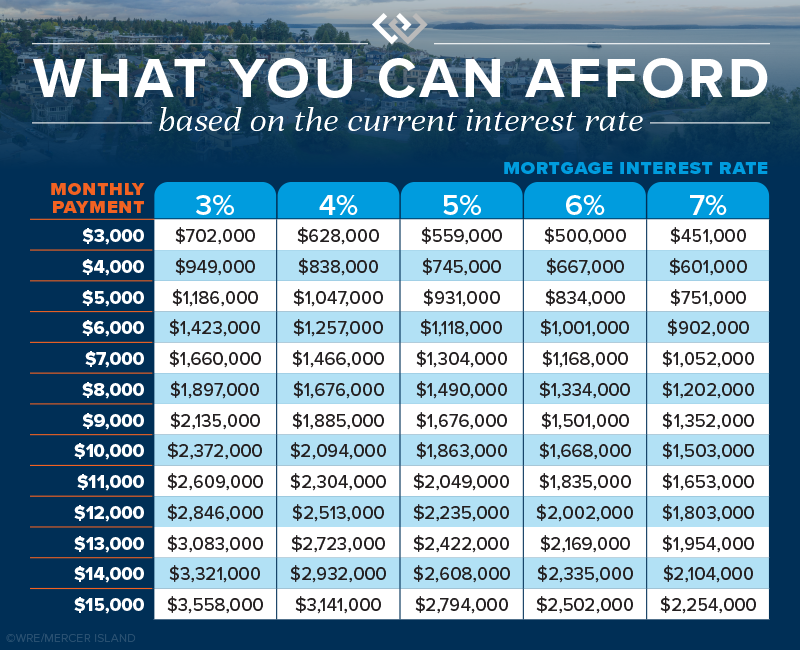
Interest Rates: In addition to being more selective about the home itself, it pays off to understand how interest rates impact your monthly housing cost. It’s a bigger deal than you might think. Every 1% increase in interest rate equates to roughly a 10% decrease in buying power. Said differently, a 10% drop in home sale price would be wiped out by a subtle 1% increase in mortgage interest rate. This means you can obtain a much more expensive home when rates are low, whereas higher rates get you less home—even though you still pay the same monthly payment.
If you have $5,000 a month to budget for a house payment (before taxes and insurance), you could purchase a $931,000 house at a 5% mortgage rate. If rates went up to 6%, the same monthly payment would only get you an $834,000 home. Your buying power diminishes considerably with each bump up in rates.
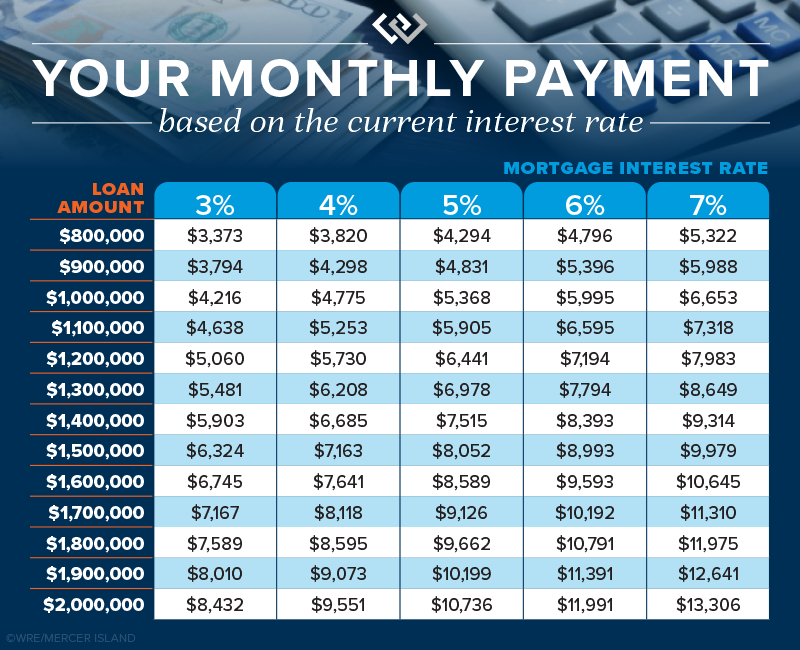
This second chart below shows how interest rates impact monthly payments. If you’re purchasing a $950,000 house at a 5% interest rate, you’ll be paying $596 less every month than if rates were 6%. That adds up quick…$7,152 in one year alone!
Job and Location Stability: Like nearly any investment vehicle, being able to buy and sell on your own time allows you take advantage of ideal market conditions or hold until a more favorable market returns. In an uncertain market, you should plan to be able to stay put for a minimum of 5-7 years if needed. If relocation or job loss is a distinct possibility, waiting to buy might avoid loss as a result of an untimely sale.
Homeownership Lifestyle: For many, homeownership represents a life accomplishment, independence, and financial security. For others, one more thing requiring maintenance and upkeep. Knowing where you stand (at this moment in time anyway) when it comes to evaluating the pros and cons of homeownership as a lifestyle choice is a better first step than an afterthought.
Final Thoughts
Want to know how you can best protect yourself in a changing real estate market? Reach out to us for help evaluating whether it would make financial sense to buy now or wait.

We earn the trust and loyalty of our brokers and clients by doing real estate exceptionally well. The leader in our market, we deliver client-focused service in an authentic, collaborative, and transparent manner and with the unmatched knowledge and expertise that comes from decades of experience.
2737 77th Ave SE, Mercer Island, WA 98040 | (206) 232-0446
mercerisland@windermere.com
© Copyright 2022, Windermere Real Estate/Mercer Island.
Seattle & Eastside Farmers Markets: Locations, Times & More

Summer is just around the corner, and so are these farmers markets! Spend an evening or weekend finding your new favorites among the tents. Think it’s all about kale? Think again. Most offer live entertainment along with a mouth-watering variety of local brews, cheese, bread, meat/seafood, honey, hand roasted coffee, and other hidden gems (in addition to the freshly picked fruits & veggies). This year, we’re proud to sponsor the Mercer Island Farmers Market for its 15th season!
Seattle Metro
- Ballard
- Capitol Hill (Broadway)
- Columbia City
- Lake City
- Lake Forest Park
- Madrona
- Magnolia
- Phinney
- Pike Place
- Queen Anne
- Shoreline
- U-District
- Wallingford
- West Seattle
Greater Eastside
- Bellevue – Crossroads
- Bellevue – Downtown
- Carnation
- Duvall
- Issaquah
- Kirkland – Downtown
- Kirkland – Juanita
- Mercer Island (Sponsored by Windermere MI!)
- North Bend
- Redmond
- Renton
- Sammamish
- Woodinville

Seattle Metro
Ballard
Seattle’s first year-round Farmers Market, selling produce exclusively from Washington state farmers along the historic cobblestone stretch of Ballard Ave.
Sundays, 9am – 2pm | Year-Round
5345 Ballard Ave NW | Seattle
sfmamarkets.com/visit-ballard-farmers-market/

Photo courtesy of sfmamarkets.com
Capitol Hill (Broadway)
Come for Sunday brunch from food vendors who source ingredients from local, WA state farms (many of whom you’ll also meet selling their wares at the market). Live music and street performers often make an appearance, too.
Sundays, 11am – 3pm | Year-Round
E Barbara Bailey Way | Seattle
seattlefarmersmarkets.org/chfm

Photo courtesy of do206.com
Columbia City
With everything from freshly harvested Asian greens to Ethiopian eats, come check out the immense variety King County’s most diverse zip code has to offer. Bring your bounty to adjacent Columbia Park for a picnic.
Wednesdays, 3pm – 7pm | May 4 – Oct 12, 2022
37th Ave S | Seattle
seattlefarmersmarkets.org/ccfm

Photo courtesy of SouthSeattleEmerald.com
Lake City
This celebrated North End seasonal market offers unique finds grown and prepared by local farms and food artisans. Enjoy kids’ activities, too!
Thursdays, 3pm – 7pm | June 16 – Oct 6, 2022
NE 125th St & 28th Ave NE | Seattle
seattlefarmersmarkets.org/lcfm

Photo courtesy of enjoylakecity.org
Lake Forest Park
With an emphasis on fresh, locally grown food, this market is an epicurean’s delight. Browse hard cider, baked goods, preserves, meat, pasta, sauces, and prepared foods along with the locally harvested fruits and veggies. There is also one “Crafts Market” each summer featuring local artisans.
Sundays, 10am – 2pm | May 8 – Oct 16, 2022
17171 Bothell Way NE | Lake Forest Park
www.thirdplacecommons.org/farmers-market

Photo courtesy of www.thirdplacecommons.org
Madrona
Located in one of Seattle’s most diverse neighborhoods, you’ll find artisan foods as well as seasonal produce from Washington state farmers, fishers, and ranchers.
Fridays, 3pm – 7pm | May 13 – Oct 21, 2022
MLK Way & E Union St | Seattle
sfmamarkets.com/madrona-farmers-market

Photo courtesy of sfmamarkets.com
Magnolia
This popular Saturday market is nestled in the tree-lined Magnolia Village. In addition to seasonal fruits and veggies, you’ll find sweet & savory pies, fresh bread, flowers, and more!
Saturdays, 10am – 2pm | June 4 – Oct 15, 2022 + Harvest Market on Nov 19, 2022
W McGraw St & 33rd Ave W | Seattle
seattlefarmersmarkets.org/mfm

Photo courtesy of pinterest.com
Phinney
A popular gathering spot for both the Phinney Ridge and Greenwood communities, this market is right next door to a playground and offers live music in addition to the great mix of fresh produce and prepared food.
Fridays, 3pm – 7pm | June 3 – Sept 30, 2022
6761 Phinney Ave N | Seattle
seattlefarmersmarkets.org/pfm

Photo courtesy of wikipedia.org
Pike Place
No introduction needed…make it a day with great restaurants, eateries and retail shops, too.
Daily, 9am – 6pm | Year-Round (Closed Thanksgiving & Christmas)
Pike Place between Pine & Virginia St | Seattle
(206) 682-7453
pikeplacemarket.org

Photo by Daniel Schwen
Queen Anne
Seattle’s only independent farmers market, offering food, chef demos, live music, and children’s activities.
Thursdays, 3pm – 7:30pm | June 2 – Oct 13, 2022 + Harvest Markets on 10/29, 11/19 & 12/17
Queen Anne Ave N & W Crockett St | Seattle
qafm.org

Photo courtesy of qafm.org
Shoreline
Starting this year in their NEW location at the Shoreline Park & Ride, this market offers kids’ programs and live music in addition to its fresh Washington produce, organic meats, bread, honey, and prepared foods. Check out the schedule for info about vendors and entertainment.
Saturdays, 10am – 2pm | June 4 – Oct 1, 2022 + Harvest Markets on 10/29 & 12/17
18821 Aurora Ave N | Shoreline
shorelinefarmersmarket.org

Photo courtesy of www.shorelineareanews.com
University District
Seattle’s only independent farmers market, offering food, chef demos, live music, and children’s activities.
Saturdays, 9am – 2pm | Year-Round
University Way NE (the “Ave”) between 50th & 52nd | Seattle
seattlefarmersmarkets.org/udfm

Photo courtesy of pinterest.com
Wallingford
Located in Meridian Park, you can shop with the whole fam and then enjoy a picnic or playtime at the award-winning playground.
Wednesdays, 3pm – 7pm | May 25 – Sept 28, 2022
4800 Meridian Ave N | Seattle
sfmamarkets.com/visit-wallingford-farmers-market/

Photo courtesy of sfmamarkets.com
West Seattle
A South Seattle weekend destination, this market is set in the vibrant West Seattle Junction and features up to 70 vendors during the summertime peak. Great community atmosphere celebrating Washington grown food and ingredients.
Sundays, 10am – 2pm | Year-Round
California Ave SW & SW Alaska | Seattle
seattlefarmersmarkets.org/wsfm

Photo courtesy of westseattleblog.com
Greater Eastside
Bellevue – Crossroads
East Bellevue’s market features fruits, veggies & dairy products from Washington state farms along with handmade soaps, candles, greeting cards, herbal wellness products, and more. Don’t missed the locally roasted coffee and handmade ice cream sandwiches, too!
Tuesdays, 12pm – 6pm | June 7 – Sept 27, 2022
15600 NE 8th St | Bellevue
https://crossroadsbellevue.com/music-events/crossroads-farmers-market/

Photo courtesy of crossroadsbellevue.com
Bellevue – Downtown
Set in the heart of Downtown Bellevue, this market offers goods exclusively produced within Washington state—from seasonal fruits & veggies to flowers, fresh meats, artisan goods, and prepared cuisine. The Kids’ POP club empowers kids to know where their food comes from and make healthy eating choices.
Thursdays, 3pm – 7pm | May 12 – Oct 6, 2022
Harvest Markets: 10am – 2pm on Sat, 10/15; Sat, 11/19; & Sat, 12/17
1717 Bellevue Way NE | Bellevue
bellevuefarmersmarket.org

Photo courtesy of eatbellevue.com
Carnation
Set in the heart of the Sno-Valley farming district, you’ll find plenty of freshly picked produce along with live music and educational activities for the kids.
Tuesdays, 3pm – 7pm | June, July & August 2022
Bird St & Stossel Ave | Carnation
carnationfarmersmarket.org

Photo courtesy of carnationfarmersmarket.org
Duvall
Nestled alongside the scenic Snoqualmie River, this friendly market features local eggs, jams, fresh roasted coffee, arts, crafts, and baked goods in addition to the seasonal veggies, fruits, and plant starts. Live music, picnic shelters and a playground make this a fun family destination.
Thursday, 3pm – 7pm | May 5 – October 13, 2022
Taylor Landing at 16201 Main St NE | Duvall
duvallfarmersmarket.org

Photo courtesy of duvallfarmersmarket.org
Issaquah
Located at the historic Pickering Barn, this picturesque venue offers a variety of fresh farm and food-based products, concessions, and local artisans.
Saturdays, 9am – 2pm | May 7 – Sept 24, 2022
1730 10th Ave NW | Issaquah
www.issaquahwa.gov/778/Farmers-Market

Photo by Saifu Angto, courtesy of google.com
Kirkland – Downtown
This stunning setting on the Lake Washington shoreline turns shopping into a day at the beach. Peruse local produce and goods, then go for a swim or stroll along Moss Bay. Perfect for a picnic, too!
Wednesdays, 3pm – 7pm | June – September, 2022
Marina Park, 25 Lakeshore Plaza | Kirkland
kirklandmarket.org

Photo courtesy of kirklandmarket.org
Kirkland – Juanita
Set in beautiful Juanita Beach Park on Lake Washington, you’ll find as many as 30 vendors offering farm fresh local produce, herbs, honey, nuts, flowers, plants, baked good, handcrafted items, and prepared cuisine. Make it a date with live music and a picnic at the beach. There’s a great playground for the kids, too.
Fridays, 3pm – 7pm | June – Sept, 2022
Juanita Beach Park, 9703 NE Juanita Dr | Kirkland
www.kirklandwa.gov
Photo courtesy of yelp.com
Mercer Island
Our office is so proud to sponsor this year’s Mercer Island Farmers Market! Come on down for quality local Washington state produce, cheese, fish, meat, bread, and more. Check out the live music schedule, too!
Sundays, 10am – 3pm | June – Sept, 2022
7700 SE 32nd St | Mercer Island
www.mifarmersmarket.org

Photo courtesy of www.mifarmersmarket.org
North Bend
This relaxed market enjoys live music and a spectacular Mount Si view. Vendors offer fresh produce, berries, honey, flowers, baked goods, hand-crafted items, and delicious prepared foods. Two playgrounds plus play fields and a covered picnic shelter make this a fun hangout spot. Leashed pets are welcome, too!
Thursdays, 4pm – 8pm | June 9 – Sept 8, 2022
Si View Park, 400 SE Orchard Dr | North Bend
www.siviewpark.org/farmers-market.phtml

Photo courtesy of thequiltingdoberman.blogspot.com
Redmond
Going strong since 1976, the Redmond Saturday Market offers a huge selection of vendors and dazzling array of produce, flowers, cheeses, preserves, salmon, tea, and handmade goods such as pottery and soaps. You’ll love the ready-to-eat foods, too.
Saturdays, 9am – 2pm | May 7 – Oct 29, 2022
9900 Willows Rd | Redmond
www.redmondsaturdaymarket.org

Photo by Jeff, courtesy of google.com
Renton
Find exclusively Washington-produced fruits, veggies, handmade goods, arts, crafts and more right in the heart of downtown Renton at Piazza Park. Food trucks, live music, and kids’ activities such as the “Healthy Kids Corner” make this a fun spot to liven up your Tuesday.
Tuesdays, 3pm – 7pm | June – Sept, 2022
Piazza Park, 233 Burnett Ave. S | Renton
www.rentonfarmersmarket.com

Photo courtesy of yelp.com
Sammamish
Each Wednesday, the Sammamish Commons plays host to a variety of local farmers, nurseries, bakeries, artisans, food vendors, and more. Live music and kids’ activities, too!
Wednesdays, 4pm – 8pm | May – Sept, 2022
Sammamish Commons, 801 228 Ave SE | Sammamish
www.sammamishfarmersmarket.org

Photo courtesy of sammamishfarmersmarket.org
Woodinville
New location this year! Come check out downtown Woodinville’s newly renovated Schoolhouse District and find produce grown in the state of Washington (and picked fresh for that morning!). You’ll also have an array of boutique baked goods, sauces, cider, artisans, and more to peruse. Check out the calendar for live entertainment, music, demos, and other activities.
Saturdays, 10am – 3pm | May – Sept, 2022
13205 NE 175th St | Woodinville
woodinvillefarmersmarket.com

Photo courtesy of woodinvillefarmersmarket.com
We earn the trust and loyalty of our brokers and clients by doing real estate exceptionally well. The leader in our market, we deliver client-focused service in an authentic, collaborative, and transparent manner and with the unmatched knowledge and expertise that comes from decades of experience.
© Copyright 2022, Windermere Real Estate/Mercer Island.
How’s the Market? Q1 Real Estate Review

Across the region, home values continued to see huge year-over-year gains from 2021 to 2022. Most homes sold in the first 10 days and for well above the asking price. We started the year with an extreme shortage of homes for sale, resulting in an overall lower number of sales compared to the start of 2021. Buyer demand, however, remains incredibly strong.
With interest rates on the rise, buyers are feeling more pressure than ever to secure a home. We are hoping to see more listings come to market this spring and provide some much needed relief for weary house hunters.
Click or scroll down to find your area report:
Seattle | Eastside | Mercer Island | Condos | Waterfront
SEATTLE
The Seattle real estate market for single family homes is off and running! The median sale price is up 6% since the end of 2021. Which means: Seattle’s price gains were as much in the first quarter as all of 2021. Year over year, the median price rose from $800,000 in Q1 2021 to $910,000 in Q1 2022.
For anyone who has focused their home search on the Eastside and has come up empty handed in 2021, Seattle could seem like an affordable opportunity this year. Seattle’s price gains were strong, albeit conservative in comparison with the Eastside. More plentiful active inventory (relatively speaking), and a more affordable median sale price of $910,000 (vs $1,625,000 on the Eastside) indicate that Seattle could be a bright spot of hope for any buyers left behind by the Eastside’s double-digit gains.
Rising interest rates in late Q1 are sure to play a part in the weary home buyer’s decision-making process. However, the close of quarter numbers are encouraging: 82% of homes sold in the first ten days!

Click here for the full report and neighborhood-by-neighborhood statistics!

EASTSIDE
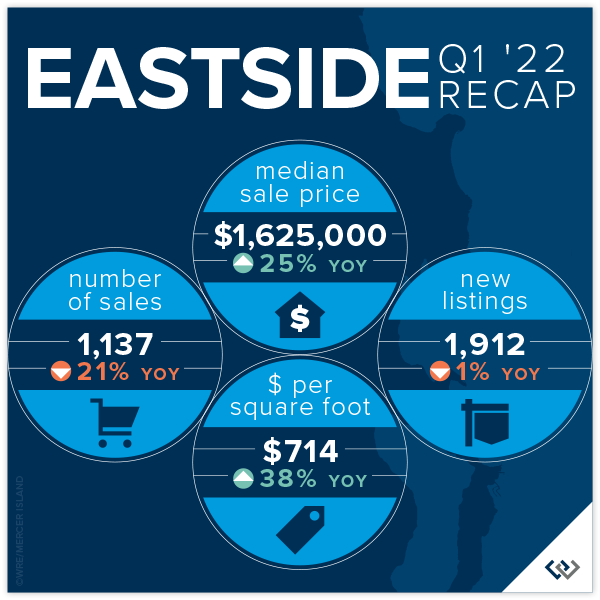
Once again Eastside Real Estate is off to an incredible start in the first 3 months of the year. Multiple offers and wildly aggressive escalation clauses are the story of the day, and not just anecdotally—the numbers don’t lie. The average list to sale price ratio was a staggering 119%, which means the typical home listed at $1,000,000 sold for closer to $1,190,000. This is an even stronger showing than the previous record high of 112% in Q1 of 2021.
New listings were relatively flat compared to Q1 of 2020 and 2021 (1912 vs 2058 and 1935 respectively) while the total number of sales were down 21% (1137 vs 1413 in the prior year). We believe this can be explained by looking at the trailing inventory from the previous Q4 in both cases (1496 vs 1238). There were just fewer homes for sale, certainly not less demand. This was reflected in the overall price gain of 25%!
Without a crystal ball it will be tough to tell exactly how much impact the market will feel from the steep rise in interest rates. In the short term, everyone seems to be taking a deep breath as we move into Q2. Overall, the Eastside’s core values—highly ranked schools, community focused neighborhoods, and close commute proximity to some of the area’s largest employers—should keep the area in high demand!
Click here for the full report and neighborhood-by-neighborhood statistics!

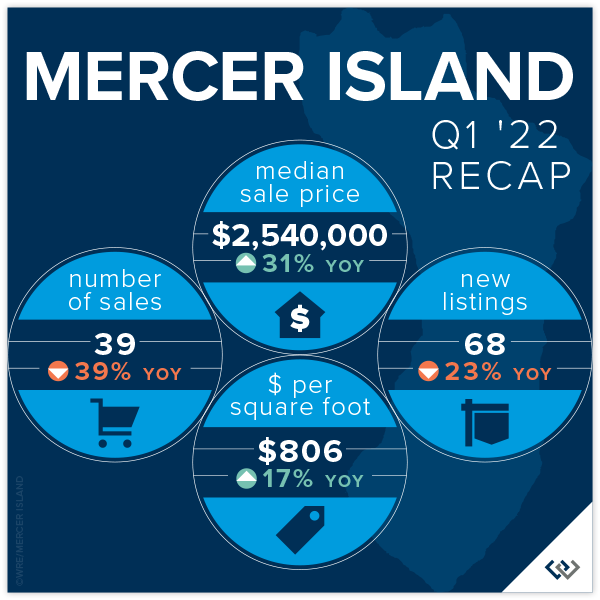
MERCER ISLAND
Mercer Island by the averages was quite shocking in Q1 of 2022: 3 homes per sale per week, 11 days on market, and 111% list price to sale price. This translates to buyers who would have otherwise joined our community casting a wider net to places like Bellevue, Issaquah, and Sammamish.
One of the affordability indicators that we historically track has become obsolete over the past few quarters: number of homes listed/sold under $1,000,000. In fact, there was only one home listed under $1,500,000 in Q1. 21 of the 39 homes had sale prices above $2,000,000 and 9 were above $3,000,000!
If you’re a buyer trying to break into the Mercer Island market, patience and the ability to act fast are the top two tips we have for you. 85% of the 39 homes for sale in Q1 sold within the first 10 days. Working with a local pro will be your biggest advantage.
Click here for the full report and neighborhood-by-neighborhood statistics!

CONDOS – SEATTLE & EASTSIDE
Condos continue to gain ground early in 2022. While the year-over-year median price gains are conservative compared to the single-family market, we see this as a good thing! Condos are a bright spot for today’s home buyers as interest rates rise.
Seattle condos saw a 9% increase (to $519,000). Eastside condos are up 16% (to $625,000) a 26% lift in price per square foot compared to Q1 2021.
Shoreline and East Bellevue led the market in median price gains year over year, up 66% and 48% respectively. Queen Anne and Kirkland were the most conservative with 1% and 4% gains respectively. 85% of Eastside condos sold over the list price, so if you’re shopping be prepared to compete.
Check out area-by-area details the full condo report.

WATERFRONT
If the first three months are any indication, it will be a tight inventory year in the Waterfront real estate market. On all shorelines, there were a total of 17 homes sold overall with an average of only 6 listings for sale at any one time. The good news is that we’re up from this time last year when there were only 14 homes sold overall.
Notably, the highest overall sale (at $12,750,000) was on Lake Sammamish in Issaquah! The most affordable waterfront this quarter was a home in Rainier Beach that sold for $1,362,500.
This brief overview of the entire Seattle-Eastside private waterfront market, including Mercer Island and Lake Sammamish, illustrates the trends occurring in our region over time. This data is interesting and insightful but cannot replace an in-depth waterfront analysis provided by a savvy broker with years of local waterfront experience.

We earn the trust and loyalty of our brokers and clients by doing real estate exceptionally well. The leader in our market, we deliver client-focused service in an authentic, collaborative, and transparent manner and with the unmatched knowledge and expertise that comes from decades of experience.
© Copyright 2022, Windermere Real Estate/Mercer Island. Information and statistics derived from Northwest Multiple Listing Service and deemed accurate but not guaranteed.
Should You Remodel or Sell Your Home As Is?

Homeowners who are preparing to sell are often faced with a dilemma about whether to remodel or sell their home in its current state. Each approach has its respective advantages and disadvantages. If you decide to remodel your home, it will likely sell for more; but the increased selling price will come at the cost of financing the remodeling projects. If you decide to sell without remodeling, you won’t spend as much money putting your home on the market, but the concern is whether you’re leaving money on the table.
Should I Remodel or Sell My Home As Is?
To answer this question, it’s important to understand the factors that could influence your decision and to work closely with your agent throughout the process.
Cost Analysis: Home Remodel vs. Selling Your Home As Is
Home Remodel
When you remodel your home before selling, you’re basically making a commitment to spend money to make money. So, it’s important to consider the kind of ROI you can expect from different remodeling projects and how much money you’re willing to spend. Start by discussing these questions with your agent. They can provide you with information on what kinds of remodels other sellers in your area are making and the returns they’re seeing as a result of those upgrades. This will help you determine the price of your home once your remodel is complete.
Then, there’s the question of whether you can complete you remodeling projects DIY or if you’ll need to hire a contractor. If hiring a contractor seems expensive, know that those costs come with the assurance that they will perform quality work and that they have the skill required to complete highly technical projects.
According to the Remodeling 2021 Cost vs. Value Report for Seattle (www.costvsvalue.com1), on average, Seattle-area homeowners paid $28,967 for a midrange bathroom remodel and $29,183 for a minor kitchen remodel, with a 76.9% and 87.7% ROI respectively. This data shows that, for these projects, you can recoup a chunk of your costs, but they may not be the most cost-effective for you. A more budget-friendly approach to upgrading these spaces may look like repainting your kitchen cabinets, swapping out your old kitchen backsplash for a new one, refinishing your bathroom tub, or installing a new showerhead. Other high-ROI remodeling projects may allow you to get more bang for your buck, such as a garage door replacement or installing stone veneer. To appeal to sustainable-minded buyers, consider these 5 Green Upgrades that Increase Your Home Value.

Selling Your Home As Is
Deciding not to remodel your home will come with its own pros and cons. By selling as is, you may sell your home for less, but you also won’t incur the cost and headache of dealing with a remodel. And since you’ve decided to sell, you won’t be able to enjoy the fruits of the remodel, anyway. If you sell your home without remodeling, you may forego the ability to pay down the costs of buying a new home with the extra money you would have made from making those upgrades.
Market Conditions: Home Remodel vs. Selling Your Home As Is
Local market conditions may influence your decision of whether to remodel before selling your home. If you live in a seller’s market, there will be high competition amongst buyers due to a lack of inventory. You may want to capitalize on the status of the market by selling before investing time in a remodel since prices are being driven up, anyway. If you take this approach, you’ll want to strategize with your agent, since your home may lack certain features that buyers can find in comparable listings. In a seller’s market, it is still important to make necessary repairs and to stage your home.
In a buyer’s market, there are more homes on the market than active buyers. If you live in a buyer’s market, you may be more inclined to remodel your home before selling to help it stand out amongst the competition.
Timing: Home Remodel vs. Selling Your Home As Is
Don’t forget that there is a third option: to wait. For all the number crunching and market analysis, it simply may not be the right time to sell your home. Knowing that you’ll sell your home at some point in the future—but not right now—will allow you to plan your remodeling projects with more time on your hands which could make it more financially feasible to complete them.
For more information on how you can prepare to sell your home, connect with one of our local agents—we’re always happy to chat about your situation and offer advice.
1©2021 Zonda Media, a Delaware corporation. Complete data from the 2021 Cost vs. Value Report can be downloaded free at www.costvsvalue.com.
This article originally appeared on the Windermere blog January 10, 2022. Written by: Sandy Dodge.
We earn the trust and loyalty of our brokers and clients by doing real estate exceptionally well. The leader in our market, we deliver client-focused service in an authentic, collaborative, and transparent manner and with the unmatched knowledge and expertise that comes from decades of experience.
© Copyright 2022, Windermere Real Estate/Mercer Island.
How’s the Market? Annual Report on Seattle Area Real Estate…

In the wake of extreme buyer demand and mind-blowing bidding wars, housing prices soared in Seattle and reached staggering heights on the Eastside. Record low interest rates were the silver lining for those buyers who were able to successfully purchase a home with financing.
2022 looks to be another strong year for real estate. Windermere’s chief economist, Matthew Gardner, predicts that interest rates will remain low and home price growth will continue—albeit at a slower, more sustainable rate than we saw in 2021. He also foresees a nice bounce back for our COVID-impacted economy in Q4 of 2022.
Click or scroll down to find your area report:
Seattle | Eastside | Mercer Island | Condos | Waterfront
SEATTLE
The Seattle real estate market, while extremely active in its own right, was far more moderate than the Eastside’s frenzied and nearly unattainable environment.
Seattle’s Median Sale Price increased by 9% to $852,000 (up from $785,000 in 2020). Neighborhoods in Lake Forest Park-Kenmore (+24%) and Shoreline (+16%) outperformed the average, while Queen Anne-Magnolia (+4%) and West Seattle (+7%) lagged behind.
Despite the tight supply of homes for sale, there was a 20% increase in the number of Seattle homes sold in 2021 (11,589) compared to 9,682 sold in 2020. Central Seattle (+31%) and Queen Anne-Magnolia (+22%) had the largest increases in number of homes sold.
79% of all Seattle homes, and 24% of those priced above $1 million, sold at or above the list price.
Homes that sold in their first ten days on the market went for an average of 7% above list price, compared to 4% over if we look at the overall average. The most competitive neighborhoods were North Seattle and Lake Forest Park, with first-ten-day sales averaging 10% above list price.

Click here for the full report and neighborhood-by-neighborhood statistics!

EASTSIDE
To say the 2021 Eastside real estate market was aggressive would be the understatement of the year. Typical home buyers requiring loans to finance their purchases found it nearly impossible to compete with the many cash or cash-equivalent, no contingency offers that often won out. With few exceptions, home buyers had to be willing to sacrifice rights and fail safes—such as inspection contingencies—that are normally taken for granted in a balanced market.
The Eastside’s Median Sale Price was $1,350,000 in 2021, up an unprecedented 32% over 2020 ($1,020,000) as desperately competing buyers drove prices to record levels. Redmond (+38%) and South Eastside (+36%) saw the largest gains, while West Bellevue (+25%) had the lowest—albeit still staggering—year-over-year increase.
89% of all Eastside homes, and 66% of homes priced above one million dollars, sold for at or above their list price. With fewer than 0.3 Months of Inventory (the number of months it would take to sell all homes currently for sale), the entire Eastside market remained ultra-competitive throughout the year. Many Eastside communities have had only a handful of homes for sale at any one time.
Homes sold an average of 7% above list price. For those sold within the first ten days, however, that number spiked to an average of 11% above list price. The most competitive neighborhoods were East Bellevue and South Eastside, with first—ten-day sales averaging 14% and 13% above list price, respectively.

Click here for the full report and neighborhood-by-neighborhood statistics!

MERCER ISLAND
Fewer than two dozen homes for sale on the Island at any given time in 2021 led to a continued ultra-competitive market. Waterfront, in particular, saw very steep increases during the year as the laws of supply and demand deftly governed prices.
Echoing the extreme price increases seen throughout the Eastside, Mercer Island’s Median Sale Price shot up by a staggering 29% over the last year. It’s worth noting, however, that this number was skewed upward by the unusually high number of luxury waterfront sales.
In 2021, 82% of all homes sold at or above their listed price. Those sold in the first 10 days on market closed for an average of 10% above their list price. On the other hand, homes on the market 11-30 days sold for an average of 2% below their list price list and homes on the market longer than 30 days sold for an average of 6% below their list price.

Click here for the full report and neighborhood-by-neighborhood statistics!

CONDOS – SEATTLE & EASTSIDE
Seattle condos saw a Median Sale Price increase of 2% (to $490,000) and Eastside condos saw a 5% increase (to $550,000) in 2021. 46% of Seattle condos and 67% of Eastside condos sold in the first ten days on the market.
60% of Seattle condos and 77% of Eastside condos sold at or above their listed price. Those sold in the first 10 days on the market went for an average of 2% and 5% above their list price, respectively.
On the Seattle side, Shoreline condos saw a 43% increase—and on the Eastside, Sammamish and Redmond condos saw a 20% increase—in Median Sale Price driven by both new construction and buyer demand. West Bellevue saw an 18% decrease due to the lack of significant new construction following the debut of luxury new construction in 2020.
Check out area-by-area details the full condo report.

WATERFRONT
There were 170 privately-owned waterfront home sales in the greater Seattle-Eastside region in 2021 (Eastside 59; Seattle 48; Lake Sammamish 36; Mercer Island 27).
The waterfront home market continues to see incredible buyer demand coupled with an extreme shortage of available waterfront homes for sale. As an indicator of demand in the luxury segment, most homes sold near to or above their list price with few outliers—something that historically has rarely happened in this sector.
This brief overview of the entire Seattle-Eastside private waterfront market, including Mercer Island and Lake Sammamish, illustrates the trends occurring in our region over time. This data is interesting and insightful but cannot replace an in-depth waterfront analysis provided by a savvy broker with years of local waterfront experience.

We earn the trust and loyalty of our brokers and clients by doing real estate exceptionally well. The leader in our market, we deliver client-focused service in an authentic, collaborative, and transparent manner and with the unmatched knowledge and expertise that comes from decades of experience.
2737 77th Ave SE, Mercer Island, WA 98040 | (206) 232-0446
mercerisland@windermere.com
© Copyright 2022, Windermere Real Estate/Mercer Island.
How’s the Market? Q2 Real Estate Review

Buyers found no relief as our region’s extreme sellers’ market continued skyward. Strong home buyer demand simply outpaced the number of available properties for sale. Fierce competition drove prices up 15% in Seattle and a staggering 38% on the Eastside as compared to Q2 of 2020. While COVID played a factor in early 2020; all things considered, prices have increased substantially in the first half of 2021.
Home affordability, or unaffordability, is one of the most significant factors impacting our communities. Many first-time buyers, retirees, and moderate wage earners are finding the tri-county region of King, Snohomish, and Pierce Counties simply out of reach…or find themselves settling for accommodations that are far less than expected. The Seattle area, much like other high-priced markets across the country, has become a region where only the affluent can afford to own real estate.
As we move into the summer, buyer fatigue, coupled with COVID reopening of recreation and vacation opportunities, may provide much needed dampening of buyer demand. Our market desperately needs more balance between buyers and sellers in the market.
Click or scroll down to find your area report:
Seattle | Eastside | Mercer Island | Condos | Waterfront
SEATTLE
Seattle’s Median Sale Price increased by 15% to $895,000 (up from $780,000 in Q2 2020). North end neighborhoods in Shoreline (+37%), Lake Forest Park-Kenmore (+37%), and North Seattle (+18%) outperformed the average while South Seattle (+9%), West Seattle (+11%). and Central Seattle (+12%) lagged slightly behind.
There was a 74% increase in the number of Seattle homes sold in Q2 (3,404) compared to Q2 2020 (1,956)—much of which can be attributed to COVID-related factors. Central Seattle (+116%) and West Seattle (+90%) had the largest increases in number of homes sold.
86% of all Seattle homes, and 33% of those priced above $1 million, sold at or above list, with the average of all homes sold at prices 6% more than list. Price increases were even more dramatic when homes sold in their first ten days on the market (76% of all listings) with an average sale price of 10% above list price. The most competitive neighborhoods were Kenmore-Lake Forest Park and North Seattle, with first 10-day sales averaging 15% and 13% above list price, respectively.

Click here for the full report and neighborhood-by-neighborhood statistics!

EASTSIDE
The Eastside’s Median Sale Price was $1,320,355 in Q2, up 38% over Q2 2020 ($958,000). Buyer demand outpacing the supply of homes for sale was the biggest factor fueling this increase. Redmond, (+48%), Kirkland (+48%), and South Eastside (+45%) saw the largest gains, while West Bellevue (+7%) had the smallest year-over-year increase.
93% of all Eastside homes, and 68% of homes priced above one million dollars, sold for at or above their list price. With 70% fewer homes for sale than in Q2 2020, the entire Eastside market remained ultra-competitive. The average of all homes sold was 9% above list price and homes sold within the first ten days went for an average of 13% above list price.
The Eastside market saw Months of Inventory (the number of months it would take to sell all homes currently for sale) remain at historical lows of between 0.3 and 0.4 months. Many Eastside communities have had only a handful of homes for sale at any one time.

Click here for the full report and neighborhood-by-neighborhood statistics!

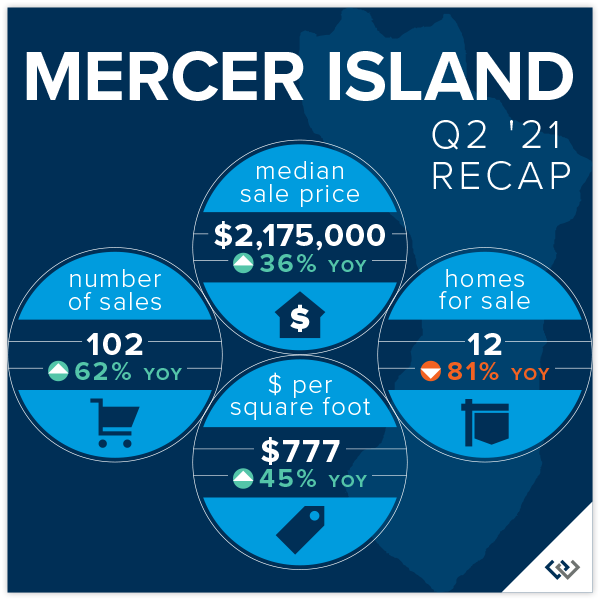
MERCER ISLAND
Fewer than two dozen homes for sale on the Island at any given time has led to a continued ultra-competitive market with 90% of all homes sold at or above their listed price. Those sold in the first 10 days on market (77% of all sales) closed for an average of 13% above their list price. Homes on the market 11-30 days sold for an average of 1% above list and homes on the market longer than 30 days sold for an average of 4% below their list price.
Click here for the full report and neighborhood-by-neighborhood statistics!

CONDOS – SEATTLE & EASTSIDE
Condo demand surged in Q2 as single-family home markets became more competitive, and in some cases, unattainable.
Seattle condos saw a 7% increase (to $488,750) and Eastside condos saw a 5% increase (to $550,000) in Median Sale Price compared to Q2 2020. Fueled by new construction development, South Seattle saw a three-fold increase in the number of condos sold, while the number of West Bellevue condos sold was up nearly double.
61% of Seattle condos and 80% of Eastside condos sold at or above their listed price. Those that were sold in the first 10 days (48% of Seattle and 70% of Eastside sales) sold for an average of 2% and 5% above their list price, respectively.
Check out area-by-area details the full condo report.

WATERFRONT
Waterfront listings were swooped up by buyers nearly as quickly as they came to market, some for staggering margins. Lake Sammamish had a record 18 sales while the Eastside had 17, Seattle 14, and Mercer Island had 7. Many waterfront homes went under contract in mere days, with an average market time in the teens instead of months.
As an indicator of demand in the luxury segment, most homes sold above their list price—something that historically has rarely happened in this sector. Some of most competitive homes sold for outrageously more than their list price as affluent buyers opened their pocketbooks for the win.
This brief overview of the entire Seattle-Eastside private waterfront market, including Mercer Island and Lake Sammamish, illustrates the trends occurring in our region over time. This data is interesting and insightful, but can’t replace an in-depth waterfront analysis provided by a savvy broker with years of local waterfront experience.

Find a Home | Sell Your Home | Property Research
Neighborhoods | Market Reports | Our Team
We earn the trust and loyalty of our brokers and clients by doing real estate exceptionally well. The leader in our market, we deliver client-focused service in an authentic, collaborative, and transparent manner and with the unmatched knowledge and expertise that comes from decades of experience.
2737 77th Ave SE, Mercer Island, WA 98040 | (206) 232-0446
mercerisland@windermere.com
© Copyright 2021, Windermere Real Estate/Mercer Island. Information and statistics derived from Northwest Multiple Listing Service and deemed accurate but not guaranteed.
Thinking About Buying a Second or Vacation Home?

Here are a few tips to make sure it’s worthwhile…
These days, having your own home away from home is a compelling concept. There are many clear benefits including being able to use your home how you wish, decorate to your taste, and include your furry friends in your time away. There are also challenges to be considered as home security, maintenance, and holding expenses are nothing to ignore.
One consideration to start with is whether the home will be solely used by your family or become an income-producing vacation rental. In addition to being a lifestyle choice, this determination will impact your income taxes and insurance needs and should be made before you embark upon this journey.
There are advantages and disadvantages to both options:


Owning as a Personal Second Home
PROS
- Comfort: Returning to the same place is familiar and often more relaxing than staying in a hotel or vacation rental. It allows you to enjoy your space as you wish and include pets and hobbies in your home away from home. Proximity to your primary residence is an important factor. How long will it take to get there? You will likely visit more often if your second home takes under three hours to travel to. Choosing a location that you will enjoy for years to come is essential to making a good purchase decision.
- Convenience: The ability to keep your possessions that are used exclusively at the second home simplifies travel and packing and makes it easier to be surrounded by the things you enjoy.
- Long-term profit: While assets fluctuate in value in the short term, vacation properties are more likely to retain their value and appreciate because they are located in popular areas with a geographically limited supply. At some point you could have a nice nest egg or a property that becomes a family vacation home for future generations.
- Future retirement options: A common retirement goal is to have a place to retreat for part of the year in addition to your main residence. Whether a second home will become a full-time venue in retirement or continue to be a part-time get-away, having it established before retirement gives you options.
CONS
- Initial cost: Buying a second or vacation home is a big investment. Down payment requirements are typically higher on non-primary residences and that cash outlay can take away from other investment opportunities.
- Maintenance: Your second or vacation home will require maintenance and upkeep just like your primary residence. You’ll need to plan to tackle that yourself or hire someone else to do it for you. Let it get away from you, and you will be spending your leisure time worrying about everything that needs to get done instead of relaxing.
- Commitment: When you are paying a significant amount of money each month for a second or vacation home, you may feel that you need to constantly visit the property to justify your investment. You’ll need to ask yourself if the idea of going to the same place over and over again is appealing or a turn-off.
- Other considerations: Evaluating and mitigating your exposure to natural disaster (fire, flood, earthquake, tsunami, etc.) and liability risks (guest injury, burglary, squatting, vandalism, arson) on a home that is vacant for much of the time is an important consideration. Determine how you will keep your home safe and secure.
Owning as an Income-Producing Vacation Rental
PROS
- Income to offset expenses: A good vacation rental property generally provides a healthy rental revenue which could potentially cover mortgage payments and operating expenses. Using an online short-term rental service like Airbnb makes it convenient to manage your rental property. Their website interface makes pricing, marketing, and communication with potential guests straightforward and easy. Airbnb will also oversee the billing process for you.
- Tax considerations: You may qualify for federal tax breaks and deductions related to holding your investment property. This can help offset the expense of owning and provide investment opportunities for the future.
- Long-term profit: Like a second home, vacation properties are more likely to retain their value and appreciate over time. At some point you could have a nice nest egg or a property that becomes a family vacation home for future generations.
- Future retirement options: While there are tax considerations to converting an income-producing property into a personal use property, owning a vacation home allows you to insulate yourself against rising real estate prices and give you options for future use.
CONS
- Initial cost: Buying a vacation home as an investment property will require both a hefty down payment and initial start-up expenses to furnish and supply the home. You will need to evaluate that cash outlay with other potential investment opportunities.
- Management and maintenance: Vacation rentals can be costly to manage, both in terms of time and money. These properties may require seasonal upkeep and special maintenance considerations. You may even incur costs to maintain or monitor the property even when it’s not actively being utilized.
- Revenue fluctuations: Vacation rental properties are particularly sensitive to seasonal fluctuations and economic downturns, which could leave you financially exposed. Having a property that is attractive in multiple seasons is a definite plus.
- Short-term rental restrictions: Many state and local municipalities are seeking to reign in short-term vacation rentals, which could put a damper on potential revenue from these properties. Many now require a minimum rental period of 30 days. In contrast, there are locations that are ideal for these kinds of short-term rentals. Look into regional ordinances, do a Google search, and check out local newspapers to discover recent talk of changing or enforcing such codes.
- Other considerations: In addition to evaluating and mitigating your exposure to natural disaster and liability risks, you will want to consider other holding expenses. These might include higher renovation and repair costs due to high-use or damage. Most travelers expect the latest appliances and furnishings, so you will have to update every few years. Unfortunately, short-term renters are less likely to report any necessary repairs and guests are far less likely to treat the property with respect since there is no sense of ownership or obligation.
Final Thoughts
Regardless of your decision to use the property personally or as an investment, checking in with your CPA and financial advisor is a good first step. They can advise you of pros and cons of each approach, States that are more or less favorable to own a non-primary residence in, and whether you should establish a trust or LLC to hold the property in.
Having a savvy real estate broker help you understand the local scene, evaluate options, and provide vetted resources is essential, especially when you are looking in an area you are less familiar with.
Still have questions? Conact me for assistance with exploring a second and vacation home purchase locally, or I can refer you to a great broker in other areas you are considering.
We earn the trust and loyalty of our brokers and clients by doing real estate exceptionally well. The leader in our market, we deliver client-focused service in an authentic, collaborative, and transparent manner and with the unmatched knowledge and expertise that comes from decades of experience.
2737 77th Ave SE, Mercer Island, WA 98040 | (206) 232-0446
mercerisland@windermere.com
© Copyright 2021 Windermere Mercer Island
How’s the Market? Q1 Real Estate Review…

An extreme sellers’ market, driven by too few homes for sale and incredibly low mortgage interest rates, led to the most aggressive multiple offer bidding wars we have experienced in our region. There are simply dozens of buyers for nearly every home that comes to market. To be competitive, most buyers did their home research prior to writing an offer, waived typical protective contingencies—including financing, appraisal, title, and inspection—and drained their savings and investment accounts to pay cash or fund discrepancies between the purchase price and appraised value.
The ability to secure a suitable home in a neighborhood of choice is a luxury not afforded to many buyers, regardless of assets. Indeed, the lack of inventory for sale and competitiveness of the market has kept many current homeowners from moving to a home that would better suit their needs or commute.
Home affordability, or unaffordability, is at crisis levels. Most homes are completely unaffordable to first-time buyers and moderate wage earners who are finding it increasingly difficult to work and live within King County. Snohomish and Pierce Counties are not far behind. While cities and counties are coming to the table to address this issue, the potential solutions will take years to implement and see relief.
Time will tell if For Sale inventory levels will increase as we move further into our peak spring season market.
Click or scroll down to find your area report:
Seattle | Eastside | Mercer Island | Condos | Waterfront
SEATTLE
Seattle’s Median Sale Price increased by 7% to $800,000 (up from $750,000 a year ago in Q1 2020). Shoreline (+11%), Lake Forest Park-Kenmore (+11%), and South Seattle (+9%) outperformed the average while West Seattle (-2%) and Queen Anne-Magnolia (+4%) lagged.
There was a 39% increase in the number of Seattle homes sold in Q1 (2,271) compared to Q1 2020 (1,632)—much of which can be attributed to emerging COVID concerns in 2020 coupled with increased mobility in 2021. Queen Anne-Magnolia (+91%), West Seattle (+51%), and North Seattle (+47%) had the largest increases in number of homes sold, although all neighborhoods except Lake Forest Park-Kenmore saw double-digit increases in total sales.
75% of all Seattle homes, and 19% of those priced above $1 million, sold at or above their listed price. The most competitive Seattle markets were Kenmore-Lake Forest Park and North Seattle, with sales in the first 10 days averaging 111% and 110% of their listed price, compared to the 107% average for all Seattle neighborhoods combined.

Click here for the full report and neighborhood-by-neighborhood statistics!

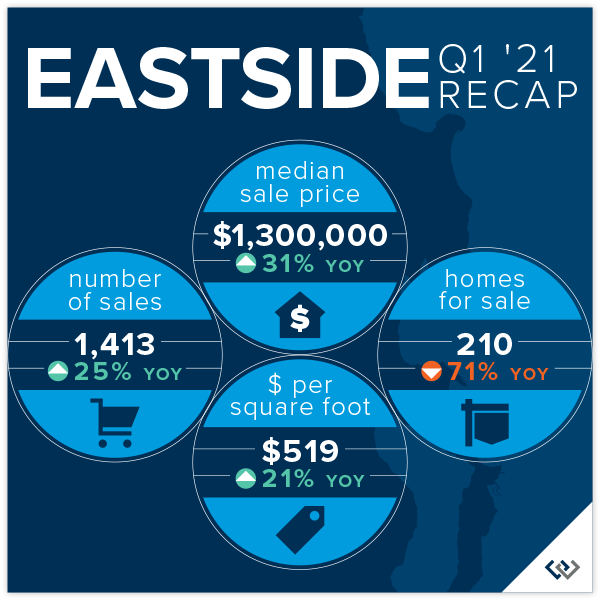
EASTSIDE
The Eastside’s Median Sale Price was $1,300,000 in Q1, up 31% over Q1 2020 ($989,950). Movement of companies and households to the Eastside and the extreme lack of a supply of homes for sale were the biggest contributors to this increase. South of I-90 (+39%) saw the largest gains, while the higher-priced markets of Kirkland (+16%), Mercer Island (+17%), and West Bellevue (+22%) had the smallest year-over-year increases—although being well into the double-digits, they could hardly be considered small.
85% of all Eastside homes, and 59% of homes priced above one million dollars, sold for at or above their list price. With 71% fewer homes for sale than in Q1 2020, the entire Eastside market remained ultra-competitive. East Bellevue sales topped the charts with an average sale price of 112% above list price for sales occurring in the first 10 days on the market.
The Eastside market saw Months of Inventory (the number of months it would take to sell all homes currently for sale) remain at historical lows of between .3 and .6 months. Despite the limited supply of homes for sale, there was a 25% increase in the number of Eastside homes sold in Q1 (1,413) compared to Q1 2020 (1,133)—much of which can be attributed to emerging COVID concerns in 2020 and in-migration to the Eastside.
Click here for the full report and neighborhood-by-neighborhood statistics!

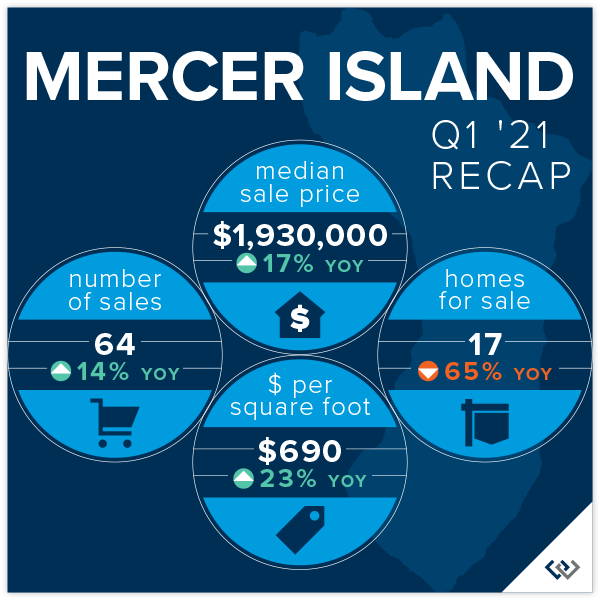
MERCER ISLAND
Most notable on the Island was the continued lack of affordable housing options with no sales below $1 million, and only 10 sales below $1.5 million, in Q1. High end sales dominated the market with 30 of the Island’s 64 sales of homes priced $2 million and above. Mercer Island waterfront listings remained depleted with an average of 2 waterfront homes for sale at any given time and a mere 3 sales in all of Q1.
Q1 saw an average of only 17 homes available for sale—an unbelievable low for a typically burgeoning Q1 on the Island. This has led to a continued ultra-competitive market for the most desirable homes, especially those offering one-level living, a main floor owner’s suite or prime waterfront.
A staggering 81% of all homes sold at or above their listed price and those that sold in the first 10 days (75% of all sales) closed for an average of 110% of their listed price. That increase equated to sellers receiving an average of nearly $200,000 above their listed price at Island’s median sale price.
Click here for the full report and neighborhood-by-neighborhood statistics!

CONDOS – SEATTLE & EASTSIDE
Condos have remained an attractive and more affordable option for entry-level buyers who might otherwise rent. As single-family home markets become more competitive, condo ownership becomes a more compelling—and many times the only—option for those wishing to begin their homeownership journey.
While the number of single-family homes for sale has been on the decline regionally, Seattle condos experienced a 45% increase in the number of units for sale while Eastside condos saw 23% fewer units for sale compared to Q1 2020. Both Seattle (+18%) and the Eastside (+30%) saw an increase in the number of Q1 sales.
Seattle condos saw a 3% increase (to $476,000) and Eastside condos saw a 9% increase (to $535,000) in Median Sale Price compared to Q1 2020. Fueled by new construction townhome development, South Seattle posted a 56% increase in its Median Sale Price during that same period. On the Eastside, with townhomes providing a solid alternative to lacking single-family homes, Sammamish was a standout with a 16% increase over Q1 2020
51% of Seattle condos and 70% of Eastside condos sold at or above their listed price. Those that were sold in the first 10 days (35% of Seattle and 55% of Eastside sales) sold for an average of 103% of their listed price.
Check out area-by-area details the full condo report.

WATERFRONT
With a meager combined average of only 7 homes for sale (compared to 26 in Q1 2020) Mercer Island and Eastside waterfront headlines could only read that there was nearly nothing available for sale in Q1. The Seattle market was just above typical inventory levels (with an average of 12 homes for sale compared to 10 in Q1 2020) while Lake Sammamish maintained its two-year running low of 5 homes for sale.
While many waterfront homes went under contract in mere days, they did not see the dramatic price escalations in Q1 that the more affordable, non-waterfront market has experienced. In fact, only one sale closed at (a fraction of 1%) above its listed price. While 4 of the 14 Q1 sales closed at 100% of their listed price, a fair amount of price negotiation was far more common.
This top-level overview of the entire Seattle-Eastside private waterfront market, including Mercer Island and Lake Sammamish, provides a glance into the trends occurring in our region over time. It is interesting, and insightful, but in no way replaces an in-depth analysis on waterfront value provided by a savvy broker with years of local waterfront experience.


We earn the trust and loyalty of our brokers and clients by doing real estate exceptionally well. The leader in our market, we deliver client-focused service in an authentic, collaborative and transparent manner and with the unmatched knowledge and expertise that comes from decades of experience.
© Copyright 2021, Windermere Real Estate/Mercer Island. Information and statistics derived from Northwest Multiple Listing Service and deemed accurate but not guaranteed.
The Four Phases of Remodeling

As with anything in life, a remodeling project can come with its ups and downs. Certain phases seem to go a mile a minute, while others feel like they’ve lasted a lifetime and a half, all while it looks as though nothing is being completed. Fear not—this is pretty typical. And, while every project is different, a good portion of renovations have four major phases, what I’m calling the Honeymoon, the Midproject Crisis, the Renewal of Vows and the Happily Ever After…

After weeks of searching for a remodeler in your area, calling references and working toward an agreeable price, you say, “I do,” sign the contract, finalize the design and begin work in two weeks. There’s a little nervousness in the air, but as you enter the Honeymoon phase, the mood is mainly one of excitement.
Demolition Begins
Normally one of the quickest moving stages of a remodel, demolition makes it look as if a lot of work is being done practically overnight. Cabinetry is removed, walls are torn down, appliances are taken away and, in a matter of days or weeks (depending on the size of your project), you’re staring at a blank canvas.
After that, any necessary framing and structural work will begin. Framing usually isn’t as exciting or fast-paced as demolition, but still, there is visible progress almost daily. At this point, you and your partner are walking on air. The rate of work is astounding, and you’re still very excited (although maybe a little less nervous now) about the entire project.
Speed Bumps Ahead!
Like a delayed flight on a real honeymoon trip, there are obstacles that can slow down this phase, specifically during demo:
- Discovery of toxic materials like lead or asbestos
- Building permit delays
- Unexpected structural elements (like pipes) revealed during demolition
Don’t panic. These delays happen often, and it’s worth accounting for and accepting these hurdles before you even begin to think about renovating.
Rolling With the Punches
Here are a few tips to help your honeymoon run more smoothly:
- Embrace change. Really. Give change a huge hug. Get to know it on a personal level. Because no matter what room you’re touching (whether it’s the kitchen or a teensy guest bath), it’s likely that you use that room daily. The sooner you accept that this room (major or not) will be unavailable for a period of time, the sooner you’ll be able to adapt your daily routines to fit around it.
- Love your microwave. This applies to kitchen remodels specifically. As soon as demo is done, your primary cooking and eating area will be gone. Before your project starts, find an untouched room in your home to create a mini kitchen that will include necessities such as a microwave, toaster oven and coffee pot. Think of it as the mini kitchen you had in your dorm or apartment in college and revel in the nostalgia.
- Don’t worry too much. I know this sounds hard—OK, really hard, especially for control freaks like me—but trusting your building professionals to know what they’re doing (even if you do come across one of the aforementioned speed bumps) will really help you keep your head on straight. And if you do have questions or concerns…
- Communicate! I cannot stress it enough. Talk with your contractor, talk with your
significant other—talk, talk, talk. Ask questions, bring up budgetary concerns, muse over paint colors. Whatever is on your mind, getting it out of your head and into the air is beneficial for everyone involved (especially you).

Similar to a Midlife Crisis, the Midproject Crisis is full of sobering questions: What’s my contractor doing? Are we still moving forward as planned? Was this really all worth it? And of course: What is the meaning of life? Fear not: Progress is still occurring, even if it’s not as obvious as demolition was.
Typically, once demolition and framing is finished (the Honeymoon Phase) and before sheetrock is put up, mechanicals will begin. (This probably is referred to as “mechanical rough-in” or “mechanical rough” by your contractor.) Mechanicals refer to the guts of the house: electrical; plumbing; and heating, venting and air conditioning (HVAC). Like our own guts, most of the work done during mechanicals occurs behind the scenes:
- Electrical: The groundwork for all new light fixtures, outlets, switches and appliances will be done during this phase. New wiring will be run in the walls and ceilings, electrical boxes will be installed for future fixtures, and electrical panels may be upgraded so they can handle heavier loads (this is especially prevalent in remodels where appliances are added). At this point, electricians are making sure that everything that will need power will have access to it and meet your municipality’s building code.
- Plumbing: As with electrical, plumbing rough-in ensures that all plumbing fixtures, appliances and other water features will be supplied with water, gas (if your house uses natural gas) or both. So pipes may be moved or installed in new places, shower pans (the things that make sure the water stays in the shower) are installed and inspected, and gas lines may be moved, extended or even put in.
- HVAC: Unlike electrical and plumbing, HVAC is the only mechanical where nearly all the work is completed during the rough-in stage. Pathways for new vents (for bath exhaust fans or kitchen vent hoods) are determined and vents are installed, air conditioning units may be replaced, and air return vents are located in appropriate positions.
More Bumps
It’s around this time that I’ve often seen homeowners concerned about progress. Yes, plumbers are there, but where are the new sinks? Why isn’t there a single light fixture installed yet? Is the HVAC guy even working, or is he just taking a nap in the attic?
The other contributing factor to the crisis is the fact that any speed bumps that crop up during this phase take a bit more time to resolve. Overall, the placement of existing framing is the biggest obstacle in mechanical rough-ins.
Another obstacle is the condition of existing mechanicals. Any wiring, plumbing or venting that is found to be damaged, dangerous or just not up to par with your municipality’s building code will likely need to be remedied.
If your job is permitted, inspections for mechanicals will occur during this stage. City building inspectors are well known for being thorough. If you don’t have everything just right (which ultimately is good, because they’re looking out for your safety), they will not hesitate to make your contractor fix the issue before any work can continue.
Communication is key to getting through the Midproject Crisis. I know it may be tempting to ask for advice from neighbors and friends, but in the end, the person with the most knowledge about your project is your building professional. See if you can get on your contractor’s schedule for a recurring biweekly meeting. It will help make the Midproject Crisis less of a crisis and more of an extended honeymoon.

Yay, you’re halfway there! After weeks (or months) of being in a state of disarray, everything you’d hoped and dreamed about is coming true and you’re feeling ready to say “I do” to your contractor all over again. This is what your contractor will probably refer to this as the “finish out” or “trim out” phase—finishing and beautifying what was started in the first couple of months. Here’s what happens:
- Sheetrock. Holes made during rough-in will be patched, new Sheetrock will be put up at any new walls or ceilings, and texture will be applied to make your walls look like walls again.
- Trim carpentry. There are a few different types of trim that may be installed at this phase: baseboard (which runs along the joint where the bottom of a wall meets the floor), door and window casing (which is installed around the perimeters of doors and windows) and crown molding (which is run along the joint where the top of a wall meets the ceiling). Trim is purely optional — some more contemporary designs forgo it entirely — but it is meant to create a finished, unified look.
- Cabinetry. The installation of cabinetry is usually around the time when I see a little glimmer come back into a homeowner’s eyes. This is when the kitchen starts looking more like a kitchen, but it’s also when you can visualize how your other storage pieces, such as built-ins and bathroom cabinets, will change the function of your home.
- Electrical and plumbing trim. This is the other big “wow” that comes with the finish-out phase. A master bathroom can start to look completed when tile and cabinetry is installed, but throw in a freestanding tub and a shower full of rain heads, handheld fixtures and a steam unit, and suddenly you’re not looking at a mostly done, unidentifiable space—you’re looking at your master bathroom. The same goes for electrical items like decorative light fixtures or appliances. Seeing new stainless steel (or whatever your preferred finish is) appliances being brought into and installed in your kitchen make most people go starry-eyed and drool a little. No judgment here—I’ve done the same.
- HVAC trim. I mentioned in the last installment that most HVAC work is done during the rough-in stage, so what is left? Essentially, all that needs to be done is the installation of vent covers and thermostats and maybe a little tweaking of the air-conditioning system. Nothing too exciting, but it should be noted nonetheless.
- Miscellaneous. Like I said, there is a lot that can be going on during the trim-out stage. Flooring—such as carpet, wood, tile or laminate—will be installed. (Flooring installers are known for insisting that they be the absolute last people to work on a house). Tile will go up in showers and as backsplashes. Countertops will go in. Priming and painting of walls, ceilings, trim and cabinetry will be completed. A little landscaping may even be done.
I’ve harped repeatedly about how communication is key, and this still rings true during the Renewal of Vows stage. But patience is also important.
As you see new things being carried in and installed, it can be so tempting to begin moving back into your new space or using your new kitchen. But your contractor may still need some time and space to work.
There are last-minute items that will ultimately guarantee your satisfaction that need to be taken care of before you and your family can begin enjoying your new remodel. So hang in there, and your patience will be rewarded.

During this Happily Ever After stage, finally, the work is done! At last, there are no more nail guns and saws and vacuums making noise in your house. After months of destruction and disarray, it’s time to move back in and enjoy your home, sweet home, for the rest of your days (or at least until you sell it or remodel again). And though most of this phase is just you at last having the chance to enjoy the fruit of your general contractor’s labor, there are a few odds and ends that your contractor will be taking care of to make sure your Happily Ever After really lasts forever:
- Cleaning. This probably will happen before you move back into your home (or at least it should). Since day one of demolition, dust and debris have been thrown into the air and, much to your contractor’s chagrin, have crept into other places in the house that weren’t touched in the remodel. Now’s the time to do an all-inclusive clean. No, the cleaners won’t do your laundry for you, but they’ll do just about everything else, from polishing the floors to dusting the ceiling fans. The end-of-project clean is like a cleansing spa day for your home.
- Final walk-through. The last walk-through ensures that you are completely satisfied with everything—and I mean everything—in your home. This is where you will have the chance to sit down and bring up all the odds and ends that you feel need to be addressed. This can be anything from “this faucet isn’t on straight” to “there’s a scratch on the new fridge” to “my shower isn’t draining correctly.” Contractors may vary on when they hold a final walk-through, but in my experience, it’s scheduled after the homeowners move back in and have a chance to use the new space. Your contractor should’ve caught just about everything during his or her own informal walk-throughs throughout the remodel, but sometimes there are items that just don’t come to the surface until a house is lived in.
- Warranty begins. Most builders and remodelers have a warranty for their projects. The length and amount of coverage can vary, of course, but what remains constant is the promise to stand behind their work for any unforeseen circumstances that arise and need addressing. (Side note: If you’re looking at contractors right now, ask them about their warranty. This can be very telling of how they conduct their business. The more that contractors are willing to warrant their work—or the longer the warranty—the more effort they will put into getting the job done right the first time.) For some contractors, the warranty formally begins after the final walk-through is hosted and the last payment is received. After that, some will stand behind any light fixtures that fizzle, appliances that break, tiles that come loose—you name it. In an ideal world, everything would work right the first time, and it would work right forever. In our world, however, there are bad manufacturing batches and recalls and oversights that may need to be taken care of. Fear not. If you have selected the right remodeler, these issues will be handled.
What else is involved in the Happily Ever After? Absolutely nothing. Take a deep breath in, let it out, look around your new place and smile, knowing that it’s all yours, to have and to hold from this day forward, for better, for worse, for richer, for poorer, in sickness and in health, to love and to cherish till death do you part. You get the picture.
Should you move or remodel?
Will remodeling pay off when it’s time to sell?
Find a Home | Sell Your Home | Property Research | Neighborhoods | Market Reports | Our Team
We earn the trust and loyalty of our brokers and clients by doing real estate exceptionally well. The leader in our market, we deliver client-focused service in an authentic, collaborative and transparent manner and with the unmatched knowledge and expertise that comes from decades of experience.
©2021 Windermere Real Estate / Mercer Island. Adapted from an article series originally published on Windermere.com.
2021 Home Trends

Ready for a fresh start in 2021? With home still the place to be, refreshing your indoor and outdoor living spaces can make a big difference in your everyday life. The stresses and challenges of 2020 have influenced the trends of 2021 with a turn toward comfort, nostalgia and independent spaces to work and play…

Sick of working at your dining room table? Desperate for a peaceful spot to exercise? You’re not alone! That’s why home offices and other clearly delineated, private spaces have become more important than ever. Even if you’re short on space, creative solutions such as turning your closet into a “cloffice” or installing folding room dividers can help you carve out space to study, Zoom or keep fit in peace.

While the houseplant trend predates the pandemic, quarantine has intensified its popularity as people yearn to bring the outdoors in. You can try out your green thumb—and improve your air quality—by using real plants as decor (try Bloomscape’s predicted winner, Ficus altissima). Just make sure you pick the right specimens for your level of natural light. Some folks are even installing special lighting for their own indoor herb or veggie gardens.
Looking for something low-maintenance? Convincing faux versions are widely available, offer more flexibility and still add a fresh look.

Dovetailing off the houseplant trend, natural materials are one of the years biggest trends—from wood-grain kitchen cabinets and countertops to rattan furniture and lighting fixtures. Natural wood-grain shelving and paneling are also increasing in prominence.
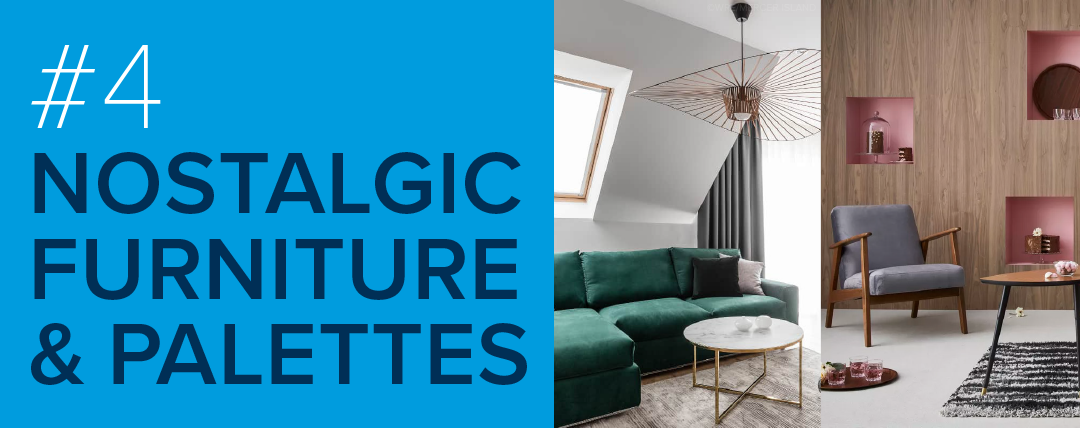
In the wake of 2020’s frightening new unknowns, people are seeking comfort with familiar throw-backs from simpler times. The funky mauve, emerald green and burnt orange of decades past are making a comeback along with paneled walls, ’80s curvy furniture and ’90s traditionalism. Retro art and accent pieces continue to be popular.

As winter contributes to our year-long cabin fever, more households are dreaming of bigger and better outdoor spaces. Park-like playgrounds, zip lines and DIY climbing walls are making an appearance in backyards. Safer al fresco entertaining spaces are also in demand with outdoor kitchens, dining areas and fire pits all on the rise.
Need an easy refresh? Try adding throw pillows, blankets or artwork in hues from Pantone’s Spring/Summer 2021 color palette.
Find a Home | Sell Your Home | Property Research
Neighborhoods | Market Reports | Our Team
We earn the trust and loyalty of our brokers and clients by doing real estate exceptionally well. The leader in our market, we deliver client-focused service in an authentic, collaborative and transparent manner and with the unmatched knowledge and expertise that comes from decades of experience.
2737 77th Ave SE, Mercer Island, WA 98040 | (206) 232-0446
© Copyright 2021, Windermere Real Estate / Mercer Island
